


On this page
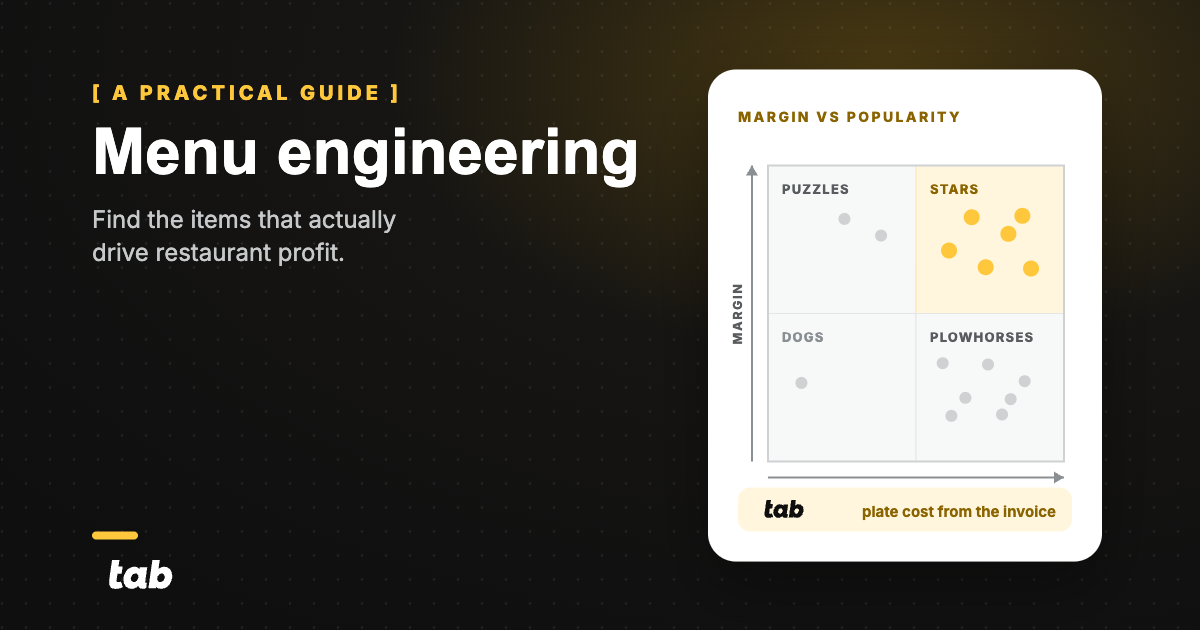
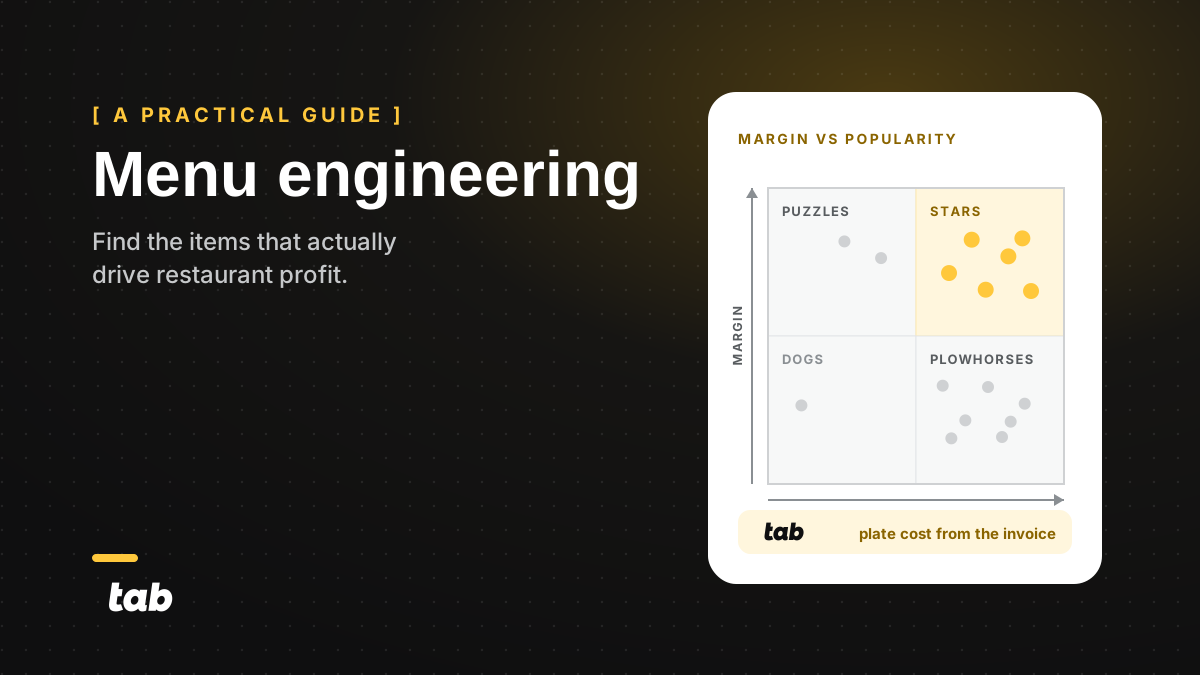
Menu engineering ranks every dish on two numbers. The first is contribution margin: menu price minus recipe cost. The second is popularity: that dish's share of its category's sales. Plot both on a 2x2 grid and every item lands in one of four boxes: stars, plowhorses, puzzles, or dogs.
Food-cost percentage alone cannot find your most profitable plate.
The item with the prettiest food cost percentage is usually not the item paying your rent. A $9 order of fries can run a 25% food cost and still put less money in the till than a $16 burger at 32.5%.
Everything here comes out of your POS and your recipe cards. Each quadrant gets one action, and none of them require reprinting the menu.
The menu engineering matrix: four boxes, four different jobs
- Chopped salad7.9% menu mix, $10.90 contribution margin
- Smash burger25.8% menu mix, $10.80 contribution margin
- House margarita20.0% menu mix, $10.40 contribution margin
- Skillet cookie6.7% menu mix, $6.10 contribution margin
- Crispy chicken sandwich17.1% menu mix, $8.60 contribution margin
- Loaded fries22.5% menu mix, $6.75 contribution margin
LowPopularity (menu mix share)High
What menu engineering actually measures
Two numbers do the sorting, and a third input decides whether you act on it.
Contribution margin is the profit dollars one plate leaves behind. Menu price minus what the ingredients on that plate cost you today. Dollars cover rent, labor, and the beer distributor. Percentages do not.
Popularity is menu mix: how many of that item sold, divided by how many items sold in the same category over the same window.
Michael Kasavana and Donald Smith introduced the method in 1982, and the four labels have outlasted every menu-design fad since.
Why the margin math matters this year
Margin pressure is not a theory this year. The National Restaurant Association reports that 42% of operators were not profitable in 2025.
The third input never shows up in a spreadsheet: prep time, station load during a rush, whether an item is the reason a regular walks in, and whether it is the only thing a vegetarian at the table can order.
The matrix tells you where to look. It does not get a vote on what leaves the menu.
The inputsGather the four numbers you need
Four numbers per item, one period, one category. Pull them in this order.
- Selling price. What the guest actually pays, before tax and after any standing discount nobody ever turned off.
- Recipe cost. Every ingredient on the plate at this week's invoice prices, including the sauce, the garnish, and the oil it fries in. A costing sheet from six months ago is a guess.
- Units sold. From the POS, over a defined window. Four weeks, or one full menu cycle, whichever is longer.
- Category units. Every item that competes for the same order. This is the denominator, and getting it wrong is how popularity math starts lying to you.
Then five formulas turn those four numbers into a quadrant.
| What you are calculating | Formula | Worked from the smash burger |
|---|---|---|
| Contribution margin | Menu price minus recipe cost | $16.00 - $5.20 = $10.80 |
| Menu mix share | Item units / category units | 620 / 2,400 = 25.8% |
| Total contribution | Contribution margin x units | $10.80 x 620 = $6,696 |
| Popularity threshold | (100% / number of items) x 70% | (100% / 6) x 70% = 11.7% |
| Margin threshold | Total contribution / total units | $21,906 / 2,400 = $9.13 |
The 70% cutoff is a setting, and you own it. It comes from the original model, and it exists so a six-item board does not call every item average. Run 80% and more items fall into the low-popularity column.
Pick one number, write it down, and use the same one every quarter so the results stay comparable.
Recipe cost is the input that goes stale fastest and breaks everything downstream. The free restaurant food cost calculator is a fast way to re-cost a plate from its ingredients and check your period food cost before any of this math gets trusted.
The worksheetBuild the menu engineering worksheet
Six items on a small taproom board, one 30-day period, 2,400 items sold.
| Item | Menu price | Recipe cost | Contribution margin | Food cost % | Units sold | Menu mix % | Total contribution | Popularity | Margin | Quadrant | Next test |
|---|---|---|---|---|---|---|---|---|---|---|---|
| Smash burger | $16.00 | $5.20 | $10.80 | 32.5% | 620 | 25.8% | $6,696.00 | High | High | Star | Hold price, re-cost every invoice cycle |
| House margarita | $13.00 | $2.60 | $10.40 | 20.0% | 480 | 20.0% | $4,992.00 | High | High | Star | Hold price, watch pour cost |
| Loaded fries | $9.00 | $2.25 | $6.75 | 25.0% | 540 | 22.5% | $3,645.00 | High | Low | Plowhorse | Test $9.00 to $10.00, break-even at 69 lost orders |
| Crispy chicken sandwich | $15.00 | $6.40 | $8.60 | 42.7% | 410 | 17.1% | $3,526.00 | High | Low | Plowhorse | Cut 75c of plate cost |
| Chopped salad | $14.00 | $3.10 | $10.90 | 22.1% | 190 | 7.9% | $2,071.00 | Low | High | Puzzle | Add $6.00 protein add-on |
| Skillet cookie | $10.00 | $3.90 | $6.10 | 39.0% | 160 | 6.7% | $976.00 | Low | Low | Dog | Re-cost, then state the reason it stays |
Ranked by food cost percentage, the margarita is first and the burger is fourth. Ranked by total contribution, the burger is first and the margarita is second.
Three things in that grid are worth a manager meeting.
The best food cost percentage on the board did not make the most money. The margarita runs a 20.0% food cost and returned $4,992. The burger runs 32.5% and returned $6,696.
Per-plate margin and total dollars are different rankings. The chopped salad has the highest contribution margin of any single plate at $10.90, and finishes fifth in total contribution because only 190 guests ordered it.
Revenue hides the gap entirely. The margarita and the chicken sandwich did almost identical sales, $6,240 against $6,150, and the margarita left $1,466 more contribution on the month.
Heads up on the denominator
This board is small enough that all six items compete for the same order. On a 40-item menu you run apps, entrees, desserts, and bar as separate categories, each with its own units total and its own two thresholds.
What to do with each quadrant
This is where to start, not what to do. A signature item, a loss leader you run on purpose, and the only vegetarian entree on the board all survive a bad box.
1) Stars: protect them and re-cost them constantly
Smash burger: $10.80 a plate, 25.8% of orders, $6,696 on the month. It is the single largest line of profit on this board and the easiest one to damage.
Hold the price for at least one more cycle, leave the recipe alone, and keep it where guests already find it. Smash burgers are also named in the National Restaurant Association's 2026 culinary forecast, which is a reason to defend the item rather than reinvent it.
The real risk to a star is silent. If ground beef moves from $4.19 to $4.79 a pound, a 6 oz patty adds 22.5 cents of plate cost and contribution margin slips to $10.58.
At 620 units, that drift quietly costs $139.50 a month, about $1,674 a year, with no menu change and no warning.
2) Plowhorses: small price move, or lower plate cost
Loaded fries: $6.75 a plate, 22.5% of orders. Guests love it, and it drags the average down.
Take the price from $9.00 to $10.00 and contribution margin goes to $7.75. That $1 move keeps paying until you lose more than 69 of those 540 orders, roughly 12.8% of them. Do the break-even math before the test, so you already know what failure looks like. Tab's free Menu AI tool compares your prices and menu composition against similar restaurants nearby, which is worth checking before a price test.
The chicken sandwich is the other kind of plowhorse. The price is fine. The plate costs too much, at a 42.7% food cost. Cut 75 cents of plate cost by portioning the aioli, right-sizing the fillet, or getting the chicken line repriced, and contribution margin hits $9.35.
That clears the new $9.26 average and moves the item into star territory at the same menu price, worth $307.50 a month at the same unit count.
Portion and waste work is where most plowhorse dollars actually live, and how to reduce food costs in a restaurant goes deeper on yields, prep waste, and the vendor side of the same problem.
3) Puzzles: give it a reason to get ordered
Chopped salad: the most profitable single plate on the board at $10.90, ordered by 7.9% of guests. The money is already in the plate. Nobody is ordering it.
Move it up in its section, give servers one honest line about it, and photograph it properly. Then add on.
A $6.00 grilled chicken add-on at $2.10 of plate cost adds $3.90 of contribution to every salad that takes it. At a 40% attach rate on 190 salads, that add-on is worth $296.40 a month without touching the base price.
Protein add-ons are also named in the 2026 culinary forecast. If you want the wider read on what guests are actually asking for before you reposition anything, restaurant trends covers the demand side.
Discounting a puzzle is the one move to avoid. People are not seeing it. Cutting the price does not make them see it.
4) Dogs: keep it only if you can say why out loud
Skillet cookie: $6.10 a plate, 6.7% of orders, $976 on the month.
Removing it does not add $976 to profit. It removes $976 of contribution and gives back some labor, some freezer space, and one line on the menu. Some of those guests were going to order dessert or nothing.
Keep a dog when there is a reason you can say in one sentence: it is the only dessert, it holds a four-top at the table for another round, prep happens off-peak, or the ingredients already live on the line for something else. Cut it when the reason is "it has always been there."
Re-cost the plate before you decide either way, because a dog with a stale recipe cost is sometimes a plowhorse.
One action per quadrant
Star
Smash burger. $10.80 margin, 25.8% of orders.
Plowhorse
Loaded fries. $6.75 margin, 22.5% of orders.
Puzzle
Chopped salad. $10.90 margin, 7.9% of orders.
Dog
Skillet cookie. $6.10 margin, 6.7% of orders.
Change one thing at a time
One item, one variable, one window. Change the price and the placement in the same week and you will never know which one moved the number.
One test, four weeks, one number
-
Week 0
Write down today's number
Units, contribution margin per plate, and total contribution for the item being tested.
-
Week 1
Change exactly one thing
Price, plate cost, menu placement, or the staff prompt. Never two.
-
Weeks 2 to 3
Leave it alone
No second change, no competing special, no promotion on the same item.
-
Week 4
Compare total contribution, not units
Keep the change if total contribution rose, revert if it fell, and re-run the matrix either way because both thresholds move.
Total contribution for that item is the only score that counts. A price increase that costs you 8% of orders and still raises total contribution worked, even though the unit count went down and the shift felt slower.
On the loaded fries, 8% is well inside the 12.8% break-even worked above, so that $1 is still paying at the end of the window.
Both thresholds move when you change anything. Cutting 75 cents from the chicken sandwich lifted the board's average contribution margin from $9.13 to $9.26, which is enough to reclassify a borderline item. Re-run the matrix after every test, on the new numbers.
Pick your window carefully. A four-week test that contains a holiday, a patio opening, a road closure, or a local festival is measuring the town, not the menu.
Tie the target to the number you already budgeted against. If you have not set one, restaurant budgeting covers how to set a margin goal per category so a test has something to pass or fail against.
The cost inputsKeep the cost side of the menu current
Every quadrant on this page depends on recipe cost being true this week. Vendor prices move, order guides change, rebates stop paying, and nobody tells you. Price a menu off stale invoices and the whole grid is a guess.
The status quo here is a purchasing binder, a spreadsheet somebody maintains on their day off, and invoices that get filed rather than read.
Tab is not a menu tool. It works next to your POS and your accounting system to keep the money side clean, so the cost inputs behind the matrix are current. Here is what that means on a Tuesday.
- A manager swipes the card at the restaurant depot, and the purchase is captured the second it happens.
- The cardholder gets a text, sends the receipt back, and tags the restaurant and the category. Tab reports an average text receipt submission time of 90 seconds.
- Coded spend syncs into QuickBooks Online through a full integration. Every other ledger gets a customizable CSV export.
- Andy AI reads invoice lines and vendor agreements and flags overpricing, price creep, and rebates that quietly stopped paying.
- Andy is included in the Pro plan at $150 per month per location. Once your Tab account is live, the Andy walkthrough itself runs about 30 minutes.
What Andy does not do is count units, calculate popularity, cost a recipe yield, or lay out a menu. It checks what you paid against what you agreed to pay. That is the input the matrix is most likely to be wrong about.
Tab reports 1,000+ restaurants on the platform, and setup takes about one week, ready for the first billing cycle.
This is not a shorter admin day. The person who was reconciling invoices at 11pm is on the floor at 7pm, and the burger's plate cost is right when you defend its price.
If ordering, receiving, and inventory are the gap, restaurant procurement software compares the tools that own those steps. If the problem is the vendors themselves, restaurant vendor management covers contracts, price changes, and how to hold a rep to a quoted price.
This week: pull your six highest-volume items, re-cost each plate at this week's invoice prices, and see how many quadrants change before you touch the menu.
Re-cost a plate before you trust its quadrant
 Item food cost percentage output
Recipe ingredient rows, entered at this week's invoice prices
Item food cost percentage output
Recipe ingredient rows, entered at this week's invoice prices
- Item food cost percentage output
- Recipe ingredient rows, entered at this week's invoice prices
Avoid these menu engineering mistakes
- Stale recipe costs. This is the most common failure, and the hardest one to see. The beef move worked through the star above pulls dollars off that item every month, with nothing on a report to flag it. Re-cost your top items every invoice cycle. A menu reprint is far too slow to catch it.
- The wrong period. Four weeks is a floor, and it has to be a normal four weeks. Holidays, weather, and a festival two blocks over will reclassify items that never changed.
- Revenue instead of margin. The margarita and the chicken sandwich above are the whole argument: nearly identical sales, very different contribution. Sales reports rank the wrong things.
- The wrong denominator. The threshold moves with the item count. Split that 40-item board into a 10-item entree section and the threshold becomes (100% / 10) x 70% = 7.0%. Score those same entrees against a whole-menu denominator and every one of them looks unpopular, because the dessert and bar units sit in the divisor.
- Menu folklore instead of your own numbers. Pages that promise a fixed profit lift never show the worksheet behind the number, and the eye-path "sweet spot" advice has no primary research holding it up. Placement is a test with a number attached, same as price.
- Cutting items without operational or guest context. Prep load, station balance, the regular who comes in for one thing, and the only item a dietary restriction can order are all reasons a bad box stays on the menu.
If you are standardizing a menu across several units, restaurant expansion strategy covers how to keep the core items consistent while local sellers vary.


