


Contents
- Know which budget you are building
- Build the restaurant budget waterfall
- Forecast sales before you budget costs
- Budget food and labor from real numbers
- Split fixed costs from manager spend
- Add cash, debt, and equipment timing
- Review budget versus actual every week
- Give every line one named owner
- Where Tab fits in a restaurant budget
- Restaurant budgeting FAQs
Most restaurant budgets are not wrong. They are just never opened again after January. The annual number gets built, approved, filed, and then the year happens to it.
That is a problem in a year when 60 percent of operators are reporting softer customer traffic, per the National Restaurant Association. The shifts driving it are covered in the restaurant trends guide.
Build it in the order the money actually moves: sales, then food and labor, then occupancy and manager-controlled spend, then cash, debt, and equipment.
This is operational guidance, not accounting or tax advice. Structure and tax treatment are questions for your CPA.
- $1.55 trillionprojected total US restaurant and foodservice sales this year
- 1.3%forecast real, inflation-adjusted sales growth
- 15.8 millionprojected industry jobs, after adding more than 100,000
- 42%of operators reported their restaurant was not profitable last year
National Restaurant Association, State of the Industry report.
Know which budget you are building
Four different documents get called “the restaurant budget,” and mixing them is why so many templates are useless. They answer different questions and they are reviewed on different clocks.
1) The startup budget
This is a one-time build cost: buildout, equipment, deposits, licenses, opening inventory, training payroll, and the cash to survive until sales stabilize. It ends the day you open. If you are pricing a new unit, the restaurant expansion strategy guide covers what a second and third location actually costs to stand up.
2) The operating budget
Your P&L plan for the year, broken into periods. Sales, cost of sales, labor, occupancy, and operating expenses. This is the one your GMs should see every week, and the only one written in percent-of-sales terms.
3) The cash forecast
What actually hits the bank and when. It is not the P&L. Accrual accounting books an invoice when it arrives; your bank account cares about the day it clears. The SBA's finance guide walks through that accrual versus cash split if the difference is new to you.
4) The capex plan
Equipment, replacements, and buildout, with the funding method attached to each item. A walk-in compressor is a capex line and a cash line in the same month, and it never shows up in full on the P&L. Financing options are broken down in the restaurant equipment financing guide.
If you only build one, build the operating budget, then bolt a 13-week cash forecast onto it. Those two carry the year.
Build the restaurant budget waterfall
Sales flow down through each cost line until whatever is left becomes cash. Budgeting is deciding, in advance, how much each line gets to take on the way down.
Every line below gets a planning driver, an owner, a review cadence, and a first move for when it goes off plan.
| Line | Planning driver | Owner | Review cadence | If it is off plan |
|---|---|---|---|---|
| Net sales | Covers times average check, by daypart and channel | GM | Weekly | Check traffic against price mix before touching costs |
| Food and beverage | Percent of sales, by menu mix | Chef or kitchen manager | Weekly | Pull invoice prices and last count, check portioning |
| Labor | Hours by daypart against forecast sales, plus taxes and benefits | GM | Weekly, mid-week checkpoint | Re-cut the schedule for the back half of the week |
| Occupancy | Lease, CAM, property insurance, property tax | Finance | Annually, or at renewal | Nothing this week. Note it for the renewal file |
| Manager-controlled spend | Fixed dollar cap per restaurant per period | GM | Weekly | Freeze non-urgent buys until the period closes |
| Fixed and admin | Contracts, software, insurance, corporate payroll | Finance | Quarterly | Re-bid the contract, not this month's spend |
| Debt service | Amortization schedule | Owner or CFO | Monthly | Talk to the lender early, never late |
| Capex | Replacement schedule plus useful life | Owner or CFO | Quarterly | Move the project, or move the funding method |
| Ending cash | Everything above, timed to the day it clears | Owner or CFO | Weekly | Delay a capex item before delaying payroll |
Stacked band showing each cost line as a share of net sales, listed in full below. Food and labor together are the prime cost at 64 percent.
- Food and beverage$372,00031%
- Labor, with taxes and benefits$396,00033%
- Occupancy, rent, CAM, property insurance, property tax$96,0008%
- Manager-controlled operating spend$132,00011%
- Fixed and admin operating spend$132,00011%
- Operating profit$72,0006%
- Net sales$1,200,000100%
Where the 6% operating profit goes
- Debt service$36,0003%
- Capex reserve$18,0001.5%
- Cash left$18,0001.5%
One worked example, not a benchmark. Replace every band with your own trailing twelve months.
Those bands are one restaurant's assumptions, not a standard. A pizza counter and a steakhouse do not share a food-cost number, and neither should copy this one.
What does carry over is the shape. Food and labor together, your prime cost, decide the year. The lines under them are mostly contracts and decisions you already made.
Forecast sales before you budget costs
Costs are a percentage of something. Get the something wrong and every line below it is wrong by the same margin.
Build the forecast from covers times average check, split by daypart and channel, not from one annual number divided by twelve. Lunch, dinner, weekend brunch, delivery, and catering each have their own count, their own check, and their own cost profile.
Then split your growth assumption into traffic and price. They are not the same lever and they do not carry the same risk.
Price is the easier one to model. Menu prices are running 3.4% higher than a year earlier, against 2.7% for groceries, per the National Restaurant Association's menu price tracking. USDA's Economic Research Service forecasts restaurant food prices to rise another 3.5% this year, inside a 3.0 to 3.9 percent range.
Heads up on the easy mistake: a budget built on 4 percent sales growth that is really 4 percent of menu pricing has zero traffic growth in it. If covers are flat and checks are up, your labor model should not be scheduled as if the dining room got busier.
Seasonality gets its own line. Build the year in periods, weight them from your own last two years, and write the assumption down next to the number so the person reviewing it in August knows what June was thinking.
Sales mix belongs here too, not in the food-cost section. Shifting guests toward higher-margin items changes your food percentage without a single vendor conversation, which is what menu engineering is for.
Budget food and labor from real numbers
Skip the industry percentage lists. Your food-cost target comes from your own menu mix, your own recipe costs, and your own vendor prices, which is why two restaurants on the same street run six points apart and both are fine.
Start with recipe cost times forecast mix, then add a waste and comp allowance you can actually defend. Working from a current plate cost is the whole game, and the restaurant food cost calculator gets you a baseline plate number fast if you do not have one.
One caution on public price data: the grocery number in the forecasting section is a retail shelf signal, not your invoice. Distributor pricing, contract terms, and rebates move on their own schedule. Budget from your invoices, then use the published forecasts as a sanity check on direction.
Labor is scheduled, not assumed. Build hours by daypart against the forecast covers, then load taxes, benefits, and any wage increases you already know are coming.
Two labor lines are worth splitting apart:
- Variable hourly labor moves with the forecast, and a GM can re-cut it mid-week.
- Fixed management salaries do not move, and pretending they flex is how a labor budget quietly lies to you.
Prime cost is the number to actually manage. Food plus labor as a percent of sales, reviewed weekly, catches problems four weeks before the P&L does. When food specifically is drifting, the tactical fixes live in how to reduce food costs in a restaurant.
Split fixed costs from manager spend
This is the split most budgets never make, and it is the one that decides whether a GM can act on the budget at all.
Fixed costs are decisions already made. Rent, CAM, property insurance, software contracts, corporate payroll, debt service. A GM cannot change them this week, so putting them in a weekly review just adds noise.
Manager-controlled spend is everything a person can decide to buy on a Tuesday. Repairs, smallwares, cleaning supplies, uniforms, local marketing, printing, small equipment, delivery fees on a rush order.
That second bucket is small as a percentage, and it is where the money goes sideways fast. It is also where cost pressure shows up first.
More than 9 in 10 operators name food, labor, insurance, energy, and swipe fees as significant challenges, per the National Restaurant Association. Two of those five are contract negotiations. Three of them get spent one purchase at a time.
Give manager-controlled spend a hard dollar cap per restaurant per period, not a percentage. Percentages move with sales, and a slow month is exactly when a broken ice machine does not care about your run rate.
Then set the rule for what happens above the cap. Who approves it, how fast, and what proof comes back with it. A cap with no approval path just teaches managers to route spend around the budget.
Add cash, debt, and equipment timing
A good P&L month and a bad bank week happen at the same time all the time. Restaurants run closer to the line than almost anybody.
The JPMorgan Chase Institute studied 597,000 small businesses and found a median cash buffer of 27 days. Restaurants held the fewest of any industry at 16 days, and 25 percent of small businesses held fewer than 13.
Sixteen days is why timing beats totals. A budget that is right for the year and wrong for the week is still a payroll problem.
Build a rolling 13-week cash forecast next to the operating budget, and put four things on it that the P&L will not show you:
- Debt service, principal included, on the actual payment dates.
- Capex, on the deposit date and the delivery date, not the depreciation schedule.
- Sales tax and payroll tax, which sit in your account looking like money that is yours.
- Deposit and holdback timing from cards and delivery platforms.
New locations get their own cash line, always. An opening consumes cash for months before it contributes any, and rolling it into the group forecast hides the drain until it is a crisis.
Review budget versus actual every week
One page, twenty minutes, every Monday morning, per restaurant.
The trap is comparing actuals to a flat monthly budget. If sales came in under plan, your variable lines should have come in under plan too. Flex them first, or you will congratulate a kitchen that actually overspent.
| Line | Budget | Actual | Variance vs budget | Variance vs flexed | Owner |
|---|---|---|---|---|---|
| Net sales | $100,000 | $96,400 | -$3,600 | n/a | GM |
| Food and beverage, 31% of sales | $31,000 | $31,500 | +$500 | +$1,616 | Chef |
| Labor, with taxes and benefits, 33% of sales | $33,000 | $34,200 | +$1,200 | +$2,388 | GM |
| Occupancy | $8,000 | $8,000 | $0 | n/a | Finance |
| Manager-controlled spend, hard cap | $11,000 | $12,400 | +$1,400 | n/a | GM |
| Fixed and admin | $11,000 | $11,100 | +$100 | n/a | Finance |
| Operating profit | $6,000 | -$800 | -$6,800 | n/a | Owner |
Flexed = the budget percent applied to actual sales. Food flexes to $29,884 and labor to $31,812 on $96,400 of sales.
Read that month the way an owner should. Against the flat budget, food looks like a $500 miss. Flexed to the sales that actually happened, it is $1,616, and labor is $2,388 rather than $1,200. The flat comparison hid more than half of the problem.
Set the thresholds before the meeting so nobody argues about what counts as a miss: sales inside 3 percent of forecast, food and labor inside 1 point of the flexed target, no dollars over the period cap, and no week projected to end under 14 days of operating cash.
Pull last week's actuals
Sales by daypart, food purchases, labor hours, card spend
Flex the variable lines
Restate food and labor at budget percent of actual sales
Flag anything past threshold
Sales 3%, food 1 point, labor 1 point, any dollar over the spend cap, cash under 14 days
Name one owner and one action
With a date, not a discussion
Check last week's actions first
Closed or carried, before opening new items
One page. 20 minutes. Every restaurant.
Nothing leaves that meeting as a topic. Every flagged line leaves as one named person, one action, and one date, and the next meeting opens by checking those before anything new gets added.
Then the question to ask out loud, every week, is the simplest one: what changed this week, and who can change it back?
Give every line one named owner
Two people responsible for a line means nobody is. One name per line, and that name gets set before the year starts.
| Line | Set by | Managed by | Reviewed by |
|---|---|---|---|
| Sales forecast | Finance, with GM input | GM | Weekly, both |
| Menu pricing and mix | Corporate | Chef and GM execute | Quarterly |
| Food cost | Chef, from recipe cost | Chef | Weekly |
| Labor hours | GM, against forecast | GM | Weekly, mid-week checkpoint |
| Manager-controlled spend | Finance sets the cap | GM spends inside it | Weekly |
| Vendor contracts and rebates | Corporate or purchasing | Purchasing | Quarterly |
| Occupancy, insurance, software | Corporate | Corporate | At renewal |
| Capex approval | Owner or CFO | Owner or CFO | Quarterly |
The dividing rule is clean: finance owns the ceilings, the GM owns the choices underneath them. Central teams set caps, contracts, and pricing. The restaurant decides what to buy inside the cap and answers for the variance.
At three or four locations this is where groups get squeezed. There is enough spend to need control and not enough scale to hire a purchasing team, so the CFO ends up chasing receipts instead of forecasting.
Where Tab fits in a restaurant budget
Tab does not build your budget, forecast your sales, run payroll, or replace your accounting system. It does two things your budget needs: it holds the caps you set, and it hands back actuals clean enough to review on a Monday. Your ledger and POS keep doing what they already do.
That covers exactly one line of the waterfall, the manager-controlled spend bucket, plus the coding work that makes every other line reviewable.
- Set the cap on the card, not just in the spreadsheet. Issue unlimited virtual and physical cards with limits per employee and per restaurant, so an $11,000 period cap is a real limit instead of a number someone reads later.
- Receipts come back the same day. A text after the swipe opens the camera, and receipts come back in about 90 seconds on average, with a note, a GL code, and the restaurant attached. Purchases that cover two units get split across both.
- Actuals land coded. QuickBooks Online is a full integration, other ledgers use a customizable CSV export, and Tab reports 85%+ higher accuracy on accounting work.
- Vendor pricing gets checked. Andy AI reads purchasing data for overpricing and missed rebates, so a bad invoice surfaces before it lands in your food line.
Base is free, with unlimited cash back on every swipe and no platform fee on the card. Card payments run weekly, and setup takes about a week, ready for your first billing cycle.
“We looked at other expense systems but it just didn't compare to the technology that Tab has.”
Teresa, Accounting Specialist, Rock Strategic (75+ units)
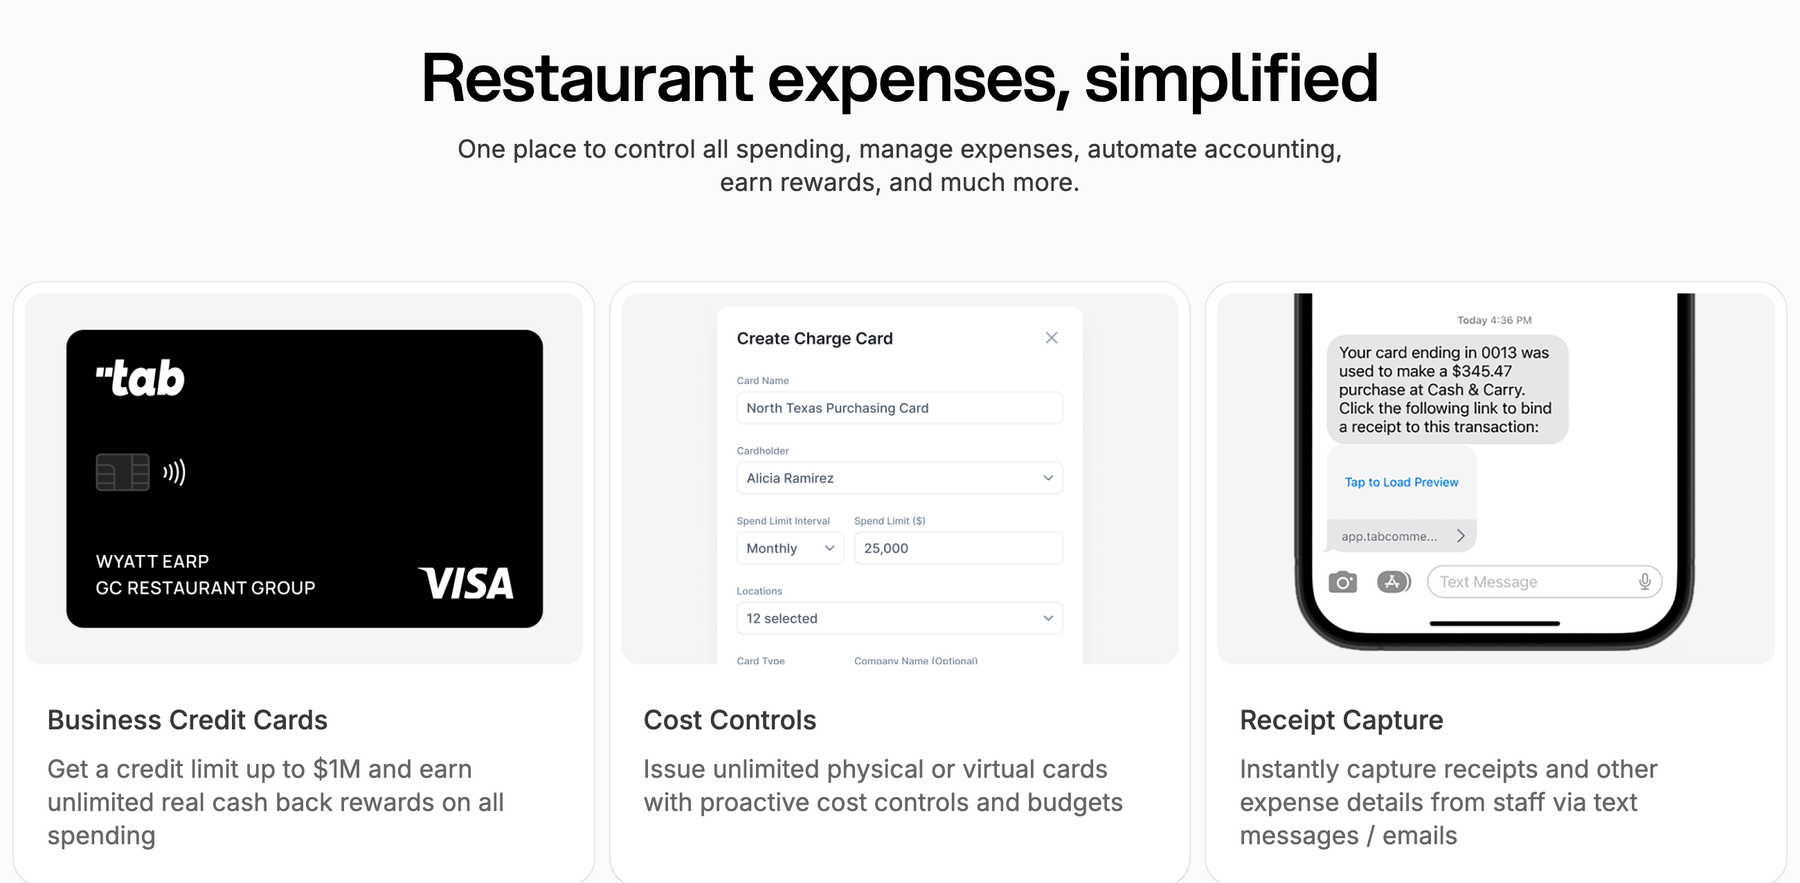
Tab puts a real limit behind the budget line you already wrote. Finance sets caps by manager and by restaurant, receipts and restaurant coding come back attached to the purchase, and Monday's budget-versus-actual review runs on detail that is already clean. Control every card and location, and stop chasing the receipts after the fact.
If the accounting side is the weak link, the QuickBooks for restaurants guide covers how the actuals should be structured, and Xero for restaurants covers the same ground for groups on a different ledger.
Restaurant budgeting FAQs
Sales by daypart and channel, food and beverage cost, labor with taxes and benefits, occupancy, manager-controlled spend, fixed and admin costs, debt service, capex, and ending cash. Each line needs an owner and a review cadence, or it is a list, not a budget.
Review budget versus actual weekly, per restaurant. Re-forecast the rest of the year quarterly, or immediately after anything structural changes: a lease renewal, a menu price move, a new unit, or a wage change. Rebuilding the whole annual budget monthly just burns the finance team.
The P&L budget plans profit on an accrual basis, so costs land when they are incurred. The cash forecast plans the bank account, so everything lands on the day it clears. A profitable month with a capex deposit and a quarterly insurance bill in it can still be a bad cash week.
Build the startup budget and the first-year operating budget as two separate documents, then give the opening its own cash line. Assume a ramp rather than a mature run rate, and fund the gap explicitly. Rolling a new unit into the group forecast hides the cash drain until it is urgent.
Partly, and only on one line. Software cannot make your sales forecast right or renegotiate a lease. It can hold a spend cap, require a receipt, and code a purchase to the right restaurant so the weekly review has usable detail. Everything above that line is still a management decision. Groups looking at where automation genuinely helps can read AI for restaurants.
One thing to do this week: take last week's actuals, flex your food and labor lines to the sales that actually happened, and see how much of the variance the flat comparison was hiding. That number is usually the argument for the rest of this.


