


On this page
- The 2026 trend action board
- 1) Value that is not a blanket discount
- 2) Smaller portions, sold on purpose
- 3) Shorter menus, better contribution margin
- 4) Nonalcoholic drinks stop being a novelty
- 5) Loyalty moves from points to recognition
- 6) Off-premises gets judged on profit
- 7) AI takes narrow jobs, not everything
- 8) Technology gets bought for labor productivity
- 9) Food costs cooled, purchasing did not
- 10) Growth favors smaller, cheaper boxes
- How to test a trend cheaply
- Where a back-office finance tool fits
- FAQs
- Pick two, park the other eight
The National Restaurant Association forecasts $1.55 trillion in sales on just 1.3% real growth, while 42% of operators say they were not profitable in 2025. Volume is not the problem. What is left after the bills is.
The seven numbers that set 2026
The 2026 trend action board
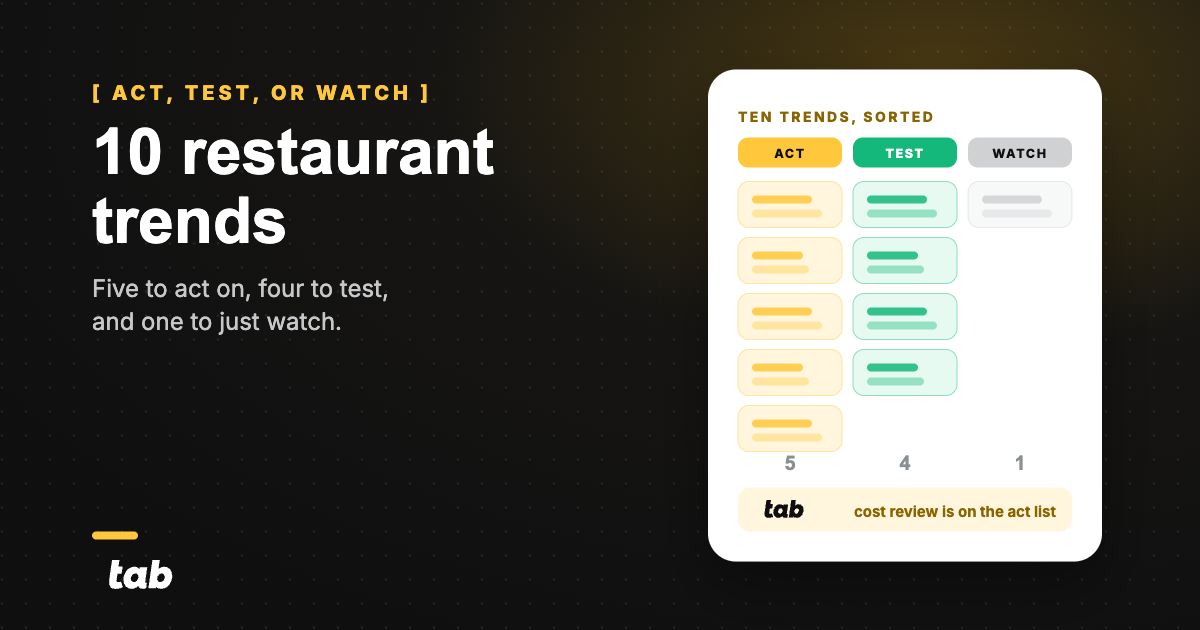
Act now means waiting costs real money. Test means the signal is strong but unproven in your restaurants. Monitor means it can wait. Pick the two lines that hit your worst number and park the other eight.
| Trend | Status | What the evidence shows | Source and date | Where it hits you |
|---|---|---|---|---|
| 1 Value without blanket discounting | Act now | Traffic soft, guests still call dining out essential | NRA State of the Industry, Feb 2026 | Check average, traffic |
| 2 Smaller portions and flexible sizes | Test | GLP-1 use went from 3% to 11% of adults since 2024, users dine out more than non-users | Gallup, May to June 2026; NRA analysis, May 2026 | Menu mix, food cost |
| 3 Shorter menus, better contribution margin | Act now | Steep price increases correlate with lower expected profit | James Beard and Deloitte, 2026 | Prep labor, waste, margin |
| 4 Nonalcoholic becomes a real category | Act now | Alcohol participation at a record low, operators call drinks a traffic driver | Gallup, July 2026; NRA, Feb 2026 | Beverage margin |
| 5 Loyalty moves to useful recognition | Test | Repeat guests already dominate visits and orders | DoorDash and SevenRooms, Mar 2026 | Frequency, retention |
| 6 Off-premises judged on profit | Act now | Roughly half of operators make no profit on third-party orders | NRA Restaurant Delivery Survey, May 2026 | Channel margin |
| 7 AI takes narrow jobs | Test | Only 28% of operators use AI for calls, 40% of booking calls go unanswered | DoorDash and SevenRooms, Mar 2026 | Missed covers, back-office hours |
| 8 Tech bought for labor productivity | Test | Moderate, intentional adopters outperform low-tech and high-tech extremes | James Beard and Deloitte, 2026 | Labor cost per cover |
| 9 Tighter vendor and purchasing review | Act now | Prices dipped year over year but the base is permanently higher | NRA food cost indicator, Aug 2026 | Food cost, invoice errors |
| 10 Smaller buildings, cheaper builds | Monitor | Chains are cutting box size and construction cost | Nation's Restaurant News, Mar 2024 | Build cost, new unit payback |
Act now
1) Value that is not a blanket discount
61% of adults still call dining out essential, yet 60% of operators reported softer traffic last year. Guests still want restaurants; they are pickier about when the money feels worth it.
Use a bundle, an off-peak window, or one item at a clear price. In DoorDash and SevenRooms research, 87% of consumers said a credit, discount, or perk influenced them to reorder. A targeted perk can move traffic. A percentage off the whole check gives away margin on items guests already planned to buy.
| The test | What it costs | Who owns it | Metric to watch | Revisit |
|---|---|---|---|---|
| One off-peak bundle on your two slowest days, priced at a real number instead of a percentage | Menu print plus one week of staff briefing | GM plus whoever sets menu pricing | Traffic on those two days, and average check on the bundle versus the same daypart last month | After 6 weeks |
Test
2) Smaller portions, sold on purpose
11% of US adults now take a GLP-1 for weight loss, up from 3% in 2024. Yet users average 7.6 restaurant visits a week versus 5.1 for non-users.
These guests are visiting more often and ordering less per visit. Test a smaller size that uses the same prep and SKUs as the full portion. It protects the visit and cuts plate cost without adding inventory.
| The test | What it costs | Who owns it | Metric to watch | Revisit |
|---|---|---|---|---|
| Add a smaller size to your three highest-volume entrees, using the same prep and the same SKUs | Recipe cards, POS buttons, no new inventory | Chef or kitchen manager | Attach rate on the small size, and whether entree count per cover holds | After 8 weeks |
Act now
3) Shorter menus, better contribution margin
The James Beard Foundation and Deloitte found restaurants that raised menu prices more than 10% were the most likely to expect lower profits.
The better lever is fewer weak items. Naf Naf Grill cut incoming SKUs 10% to 15% and saved 15 to 20 labor hours per restaurant each week. Fewer SKUs also mean less inventory, waste, and prep.
Use contribution margin to decide what stays. Tab's free menu pricing tool can price the items before you cut them.
| The test | What it costs | Who owns it | Metric to watch | Revisit |
|---|---|---|---|---|
| Cut the bottom 5% of items by menu mix in one restaurant, starting with anything using an ingredient no other dish uses | One afternoon of menu-mix analysis | Chef plus finance | Food cost percentage, prep hours, and ticket times at peak | After one full menu cycle |
Act now
4) Nonalcoholic drinks stop being a novelty
54% of US adults say they drink alcohol, down from 62% in 2023, and 17% have substituted a nonalcoholic drink. Meanwhile, 83% of operators call drinks a traffic driver.
The guest who used to order two cocktails is still sitting down. They need something worth ordering. A priced, adult nonalcoholic drink protects more of that beverage check than a soda refill.
| The test | What it costs | Who owns it | Metric to watch | Revisit |
|---|---|---|---|---|
| Add three nonalcoholic drinks priced within $2 of your cocktails, listed in the cocktail section rather than under soft drinks | One case of each ingredient plus bar training | Bar manager | Nonalcoholic drinks per cover, and beverage percentage of total sales | After 6 weeks |
Test
5) Loyalty moves from points to recognition
80% of dine-in visits and 79% of orders come from repeat guests. 65% say remembered preferences would change how often they return.
The gap is operational: three in five operators cannot identify the same guest across on-premise and off-premise visits. Your regular at table 12 and your regular on the delivery app are still two different records. Start with one list of your 50 highest-value guests and two useful preferences for each.
| The test | What it costs | Who owns it | Metric to watch | Revisit |
|---|---|---|---|---|
| Tag your top 50 repeat guests in one restaurant with two facts each, a favorite item and a dietary note, and use them at the door | Two hours of manager time per week | GM | Visit frequency for those 50 guests against the prior quarter | After one quarter |
Act now
6) Off-premises gets judged on profit
Three in four restaurant orders are consumed off-premises. But 47% of fullservice and 43% of limited-service operators say third-party delivery orders make no profit, while fees often run 15% to 29.9% of the ticket.
The app owns the guest. You own the food cost. Measure contribution margin after commission, promotions, refunds, and packaging—not channel sales alone.
That requires correctly coded fees and refunds, making this a restaurant bookkeeping job before it becomes a pricing decision.
| The test | What it costs | Who owns it | Metric to watch | Revisit |
|---|---|---|---|---|
| Pull one month of third-party statements and calculate contribution margin per order after commission, promo fees, and packaging | Half a day of bookkeeper time | Controller or bookkeeper | Margin per order by platform, compared against dine-in | Monthly, then at every contract renewal |
Test
7) AI takes narrow jobs, not everything
The clearest AI job is the phone: 40% of reservation calls go unanswered, while only 28% of operators use AI for calls and customer service.
The other useful jobs have countable failures: a receipt that never comes back, an invoice priced above contract, or a purchase coded to the wrong restaurant. If you cannot count how often the job fails today, you cannot prove the software fixed it. The AI for restaurants guide breaks down the jobs that hold up.
| The test | What it costs | Who owns it | Metric to watch | Revisit |
|---|---|---|---|---|
| Pick one job with a countable failure rate, missed booking calls or unmatched receipts, and run AI on that job only for 30 days | One vendor trial, one restaurant | GM for phones, controller for back office | Failure rate before and after, counted the same way both times | After 30 days |
Test
8) Technology gets bought for labor productivity
49% of operators still report some staffing insufficiency. Yet the same research found moderate, intentional tech adopters outperform both low-tech and high-tech extremes. Buying the most software is not the same as getting the most work done.
Name the exact labor job before adding a tool, then check whether your management software or POS already covers it.
| The test | What it costs | Who owns it | Metric to watch | Revisit |
|---|---|---|---|---|
| List every software line item, name the exact job it does, and cancel anything whose job is already covered by another tool | Two hours with the bank statement and the vendor list | Owner or controller | Total software cost per restaurant per month, and labor hours per cover | Every 6 months |
Act now
9) Food costs cooled, purchasing did not
Wholesale food prices still sit 34% above February 2020. A falling index does not mean your invoices fell. Price protection expires, cases get substituted, and rebates go unclaimed.
Check landed unit cost against the agreement you signed. A food cost calculator and the right procurement workflow cover the basics before a small group needs a purchasing hire.
| The test | What it costs | Who owns it | Metric to watch | Revisit |
|---|---|---|---|---|
| Audit four weeks of invoices from your largest vendor against contracted pricing, line by line | One day, or one purchasing analyst tool | Controller or purchasing lead | Dollars recovered, and count of lines priced above agreement | Monthly for the top two vendors |
Monitor
10) Growth favors smaller, cheaper boxes
Portillo's moved from an 11,300-square-foot standard to 7,700 square feet, while IHOP conversions cut construction costs 30% to 40%.
A smaller box lowers break-even and the sales ceiling. Model both before signing an LOI. The restaurant budgeting and equipment financing guides cover the two biggest cash decisions.
| The test | What it costs | Who owns it | Metric to watch | Revisit |
|---|---|---|---|---|
| Model your next unit at 70% of your current square footage and see whether the sales forecast still clears your target return | One afternoon in a spreadsheet | Owner plus whoever runs development | Break-even month and cash-on-cash return at both sizes | Before signing any LOI |
How to test a trend cheaply
Most trend advice fails because it has no owner, cost, or end date.
- Test in one restaurant, not the group.
- Write down one metric before you start.
- Cap the spend at what you would lose on a slow Tuesday.
- Put the review date on the calendar.
You are buying information, not the trend. A clear no is as useful as a yes, and both beat a rollout based on a headline.
Where a back-office finance tool fits
Several trends above depend on seeing spend before month end. Your POS knows what sold and your ledger knows what already closed. Tab handles the card purchases, receipts, and restaurant coding between them.
- Managers earn unlimited 1% cash back on the free Base plan.
- Tab texts for the receipt and restaurant after each swipe; average submission time is 90 seconds.
- Coded spend syncs to QuickBooks Online or exports to another ledger, while invoice checks flag price changes and missed rebates.
The payoff is cleaner books and less paper chasing. Setup takes about a week, needs no credit check, and more than 1,000 restaurants use Tab.
FAQs
Margin pressure. With 42% of operators reporting an unprofitable 2025, the defining moves protect contribution margin: targeted value, shorter menus, and per-channel profitability.
The NRA's 2026 culinary forecast highlights local sourcing, comfort foods, value menus, smashed burgers, and clear menu labeling.
In narrow jobs with countable outcomes: booking calls, invoice checks, and receipt matching. 40% of reservation calls go unanswered while only 28% of operators use AI there.
Likely. GLP-1 use rose from 3% of adults in 2024 to 11% in 2026, and users visit restaurants more often. Smaller portions work best when they share prep and inventory with the full size.
Vendor review, menu size, and nonalcoholic drinks. All three can be tested in one restaurant without a new system.
Pick two, park the other eight
Pick the two act-now lines that hit your worst number. Give each an owner and review date, then park the other eight until next quarter.
If back-office cleanup is one of them, the AI for restaurants guide shows which jobs can be handed off now and which still need a person.


